Aviation Accidents and Incidents
An Analysis of Over 40 Years of Airplane Crash Data

How safe are airlines and general aircraft? We looked at every aviation accident and incident reported to the NTSB over nearly 40 years to find out.
 In the wake of the deadly crashes involving Boeing’s 737 Max 8, airline and general aviation safety are back in the world’s collective consciousness. While air travel is often touted as one of the safest forms of transportation, these incidents have underscored the fact that when accidents occur, the results are often catastrophic. In just two crashes, 346 passengers and crew were killed – 157 in the Ethiopian Airlines Flight 302 crash and another 189 in the Lion Air Flight 610 crash.
While the 737 Max 8’s were grounded, hundreds of other planes and aircraft crash each year. In 2018 alone, the U.S. National Transportation Safety Board (NTSB) investigated 1,581 aviation accidents and incidents that left 847 people dead and another 768 people injured.
This information left us to wonder, how often do planes crash? How many people have been killed in aviation and airline accidents? Which planes and which manufacturers are involved in the most crashes?
The Chicago personal injury attorneys at Clifford Law Offices analyzed 37 years of aviation crash and incident data from the U.S. National Transportation Safety Board to find answers to these and other questions.
While most of the analysis in the article covers the years of 1982 through 2018, we have included data from the years 2019-2023 in certain areas. During those five years, a total of 7,318 aviation accidents were investigated by the NTSB – 1,601 of which were fatal.
82,727
crashes & incidents
42,226
Fatal Injuries
17,740
Serious Injuries
28,477
Minor Injuries
How safe are airplanes?
It depends on the type of aircraft that you are flying in. When looking at overall fatal crash rate, the numbers show that flight one of the safest forms of travel. The National Safety Council puts the odds of dying as a passenger of an airplane as 1 in 188,106 – the second safest form of travel behind railway travel ( 1 in 243,765). Still, each crash is much more likely to be fatal than crashes in other forms of transportation. From 1982 – 2018, 20 percent of all aviation crashes and incidents involved at least one fatality. For comparison’s sake, less than one percent of U.S. car accidents are fatal.
However, crashes are most likely to occur in single engine planes – and typically in general aviation rather than on commercial airlines. In fact, 79 percent of all aircraft accidents and 72 percent of fatal crashes involved single engine planes.
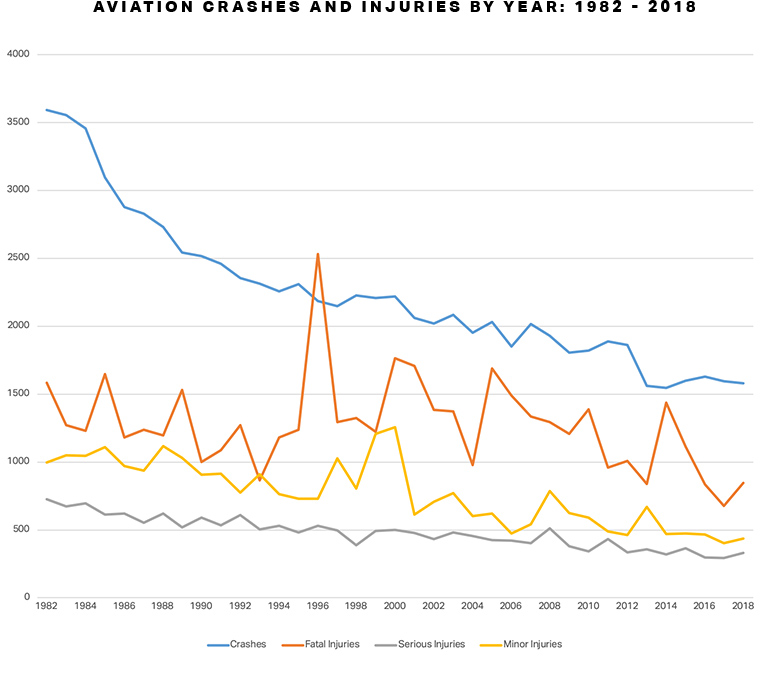
Aircraft Crashes Over Time
While total aircraft accidents have steadily decreased since 1982, fatalities have not seen the same year in year out decline.
After a 37-year high of 2,533 fatal aircraft crash injuries in 1996, the total deaths have bounced up and down seemingly at random. While it stands to reason that fewer crashes means fewer injuries and deaths, the nature of aviation accidents means that only a few major crashes can completely change the data from year to year.
Meanwhile, total aviation crashes have dropped from a high of 3,583 in 1982 down to 1,581 in 2018 – a decrease of nearly 56 percent. However, as the total crashes have gone down, the percentage of those crashes that have been fatal has gone up, from 18.2 percent in 1982 to 22.5 percent in 2018.
*We have updated the table below to include total crashes and fatal crashes from the years 2019-2023. During those years, the data does not include total fatalities or injury severity.
| event year | aviation crashes | fatal injuries | serious injuries | minor injuries |
|---|---|---|---|---|
| 1982 | 3593 | 1585 | 727 | 998 |
| 1983 | 3556 | 1273 | 673 | 1048 |
| 1984 | 3457 | 1229 | 697 | 1047 |
| 1985 | 3096 | 1648 | 612 | 1108 |
| 1986 | 2880 | 1180 | 619 | 970 |
| 1987 | 2828 | 1237 | 554 | 936 |
| 1988 | 2730 | 1195 | 620 | 1117 |
| 1989 | 2544 | 1532 | 518 | 1029 |
| 1990 | 2518 | 999 | 589 | 908 |
| 1991 | 2462 | 1087 | 535 | 913 |
| 1992 | 2355 | 1273 | 609 | 775 |
| 1993 | 2313 | 865 | 505 | 910 |
| 1994 | 2257 | 1183 | 529 | 763 |
| 1995 | 2309 | 1236 | 480 | 731 |
| 1996 | 2187 | 2533 | 532 | 729 |
| 1997 | 2148 | 1296 | 497 | 1026 |
| 1998 | 2226 | 1325 | 388 | 807 |
| 1999 | 2209 | 1221 | 491 | 1206 |
| 2000 | 2220 | 1765 | 501 | 1256 |
| 2001 | 2063 | 1709 | 478 | 612 |
| 2002 | 2020 | 1386 | 432 | 706 |
| 2003 | 2085 | 1374 | 480 | 772 |
| 2004 | 1952 | 978 | 457 | 603 |
| 2005 | 2031 | 1689 | 426 | 620 |
| 2006 | 1851 | 1489 | 420 | 473 |
| 2007 | 2016 | 1335 | 402 | 543 |
| 2008 | 1931 | 1293 | 511 | 786 |
| 2009 | 1805 | 1207 | 381 | 625 |
| 2010 | 1821 | 1390 | 343 | 589 |
| 2011 | 1889 | 959 | 432 | 488 |
| 2012 | 1861 | 1007 | 336 | 464 |
| 2013 | 1561 | 839 | 358 | 671 |
| 2014 | 1547 | 1438 | 321 | 469 |
| 2015 | 1600 | 1112 | 364 | 473 |
| 2016 | 1628 | 835 | 297 | 468 |
| 2017 | 1597 | 677 | 295 | 401 |
| 2018 | 1581 | 847 | 331 | 437 |
| 2019 | 1504 | *379 | N/A | N/A |
| 2020 | 1307 | *294 | N/A | N/A |
| 2021 | 1518 | *320 | N/A | N/A |
| 2022 | 1538 | *328 | N/A | N/A |
| 2023 | 1451 | *280 | N/A | N/A |
Why have crashes
gone down?
It is hard to understate the roles that increase safety regulation and requirements on both operators and on pilots have played in the overall reduction in crashes and fatalities – especially those in the commercial airline industry. In fact, before a passenger was killed aboard a Southwest flight in 2018, the last fatal airline crash in the United States was in February 2009. That disaster, the crash of Continental Connection Flight 3407, killed all 49 people on board and another person on the ground in Clarence, NY. The resulting lawsuits and advocacy from the families of those who were killed made sweeping changes to the airline industry. Most notably, the Airline Safety and Federal Aviation Administration Extension Act of 2010 required significantly more training for pilots – 1,500 hours up from 250 before, flight and duty time regulations, and many other industry safety and transparency requirements. Many other laws, including the Federal Aviation Regulations (FARs) as well as international conventions, regulate everything from product and aircraft manufacturing and maintenance to pilot schools and business operations for commercial as well as general aviation.
When Do Aviation Crashes Occur? A Look at Accidents by Phase of Flight.

Not all phases of flight are equal here. In fact, the person sitting white knuckled next to you with their eyes shut tight may be on to something. The NTSB data shows that takeoff and landing are, by far, the most likely parts of air travel for accidents to occur.
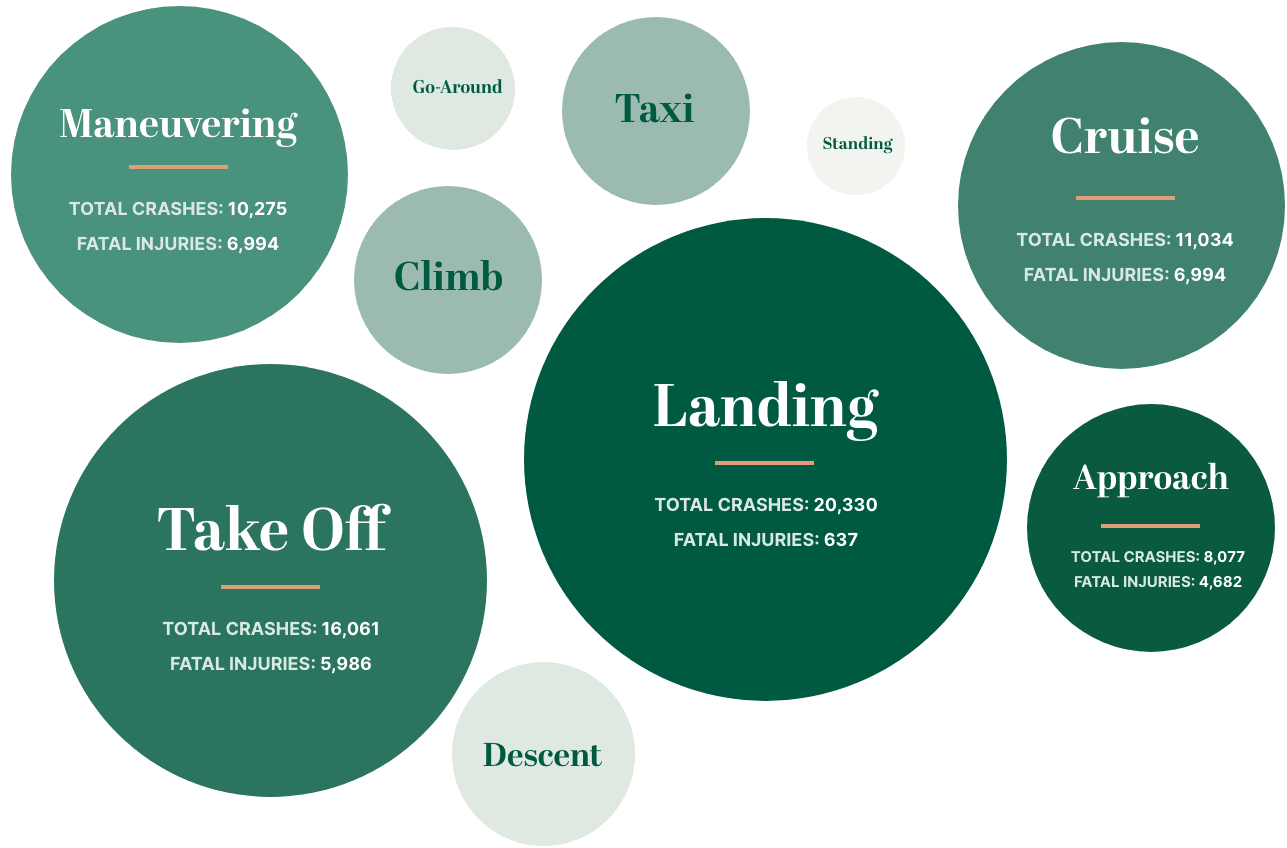
“Interestingly, despite being the most likely phase to be involved in a crash, accidents during landing were by far the least likely to be deadly”
Here is the full list of crashes by phase of flight, from most to least crashes:
- Landing: 20,330 crashes
- Takeoff: 16,061 crashes
- Cruise: 11,034 crashes
- Maneuvering: 10,275 crashes
- Approach: 8,077 crashes
- Taxi: 2,438 crashes
- Climb: 2,351 crashes
- Descent: 2,351crashes
- Go-Around: 1,685 crashes
- Standing: 1,284 crashes
However, crashes that occur during the maneuvering and cruise phases are most likely to be deadly – 39 percent of crashes during the maneuvering phase and 30 percent of crashes during the cruise were fatal. Interestingly, despite being the most likely phase to be involved in a crash, accidents during landing were by far the least likely to be deadly. Just under two percent of landing phase crashes resulted in a fatality – compared to 15.7 percent of crashes durning takeoff.
Where Aviation Accidents Occur

Between 1982 and 2018, 7,8161 aviation crashes occurred in the United States.
These crashes where scattered across the country. However, the most crashes occurred in Anchorage, Alaska – by nearly double over the next closest area, Miami, Florida with 269 crashes.
The rest of the top 25 regions for U.S. aviation crashes are:
- Anchorage, AK: 528 crashes, 47 fatalities
- Miami, FL: 269 crashes, 187 fatalities
- Albuquerque, NM: 261 crashes, 47 fatalities
- Houston, TX: 254 crashes, 57 fatalities
- Chicago, IL: 252 crashes, 31 fatalities
- Fairbanks, AK: 231 crashes, 28 fatalities
- Phoenix, AZ: 207 crashes, 42 fatalities
- Tucson, AZ: 186 crashes, 42 fatalities
- Atlanta, GA: 181 crashes, 39 fatalities
- Denver, CO: 176 crashes, 43 fatalities
- Reno, NV: 170 crashes, 128 fatalities
- San Diego, CA: 169 crashes, 82 fatalities
- Talkeetna, AK: 161 crashes, 40 fatalities
- Las Vegas, NV: 159 crashes, 34 fatalities
- Orlando, FL: 152 crashes, 36 fatalities
- Englewood, CO: 152 crashes, 27 fatalities
- Chandler, AZ: 144 crashes, 16 fatalities
- Jacksonville, FL: 142 crashes, 41 fatalities
- Palmer, AK: 142 crashes, 12 fatalities
- San Antonio, TX: 137 crashes, 39 fatalities
- Mesa, AZ: 136 crashes, 27 fatalities
- Los Angeles, CA: 134 crashes, 95 fatalities
- Fort Lauderdale, FL: 130 crashes, 41 fatalities
- Seattle, WA: 129 crashes, 17 fatalities
- Fort Worth, TX: 128 crashes, 9 fatalities
Aircraft Crashes and Fatalities by Make and Model
Which make or manufacturer planes crash the most? Which ones kill the most people?
More than half (54 percent) of all aviation accidents in the NTSB’s database involve either a Cessna (25,865 crashes), Piper (14,105 crashes)or Beech (5,098) aircraft. These three manufacturers have historically been the largest producers of aircraft for general aviation purposes – though both Beech and Cessna have since become subsidiaries of Textron Aviation.
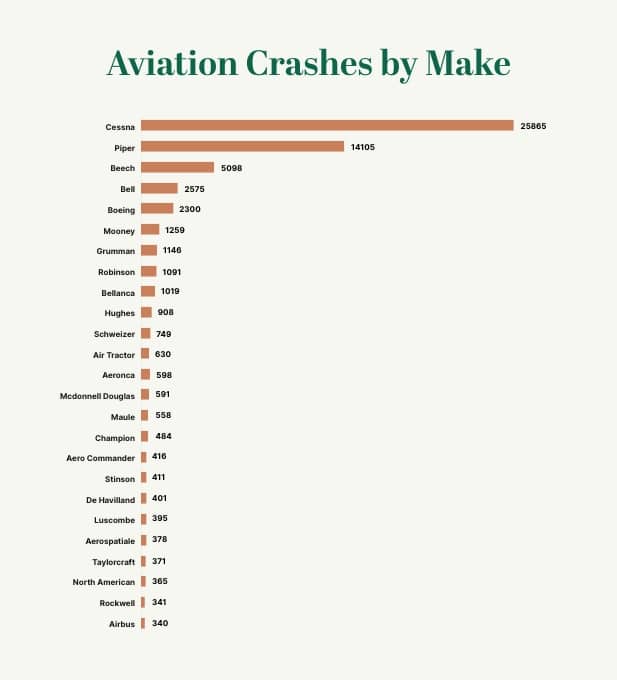
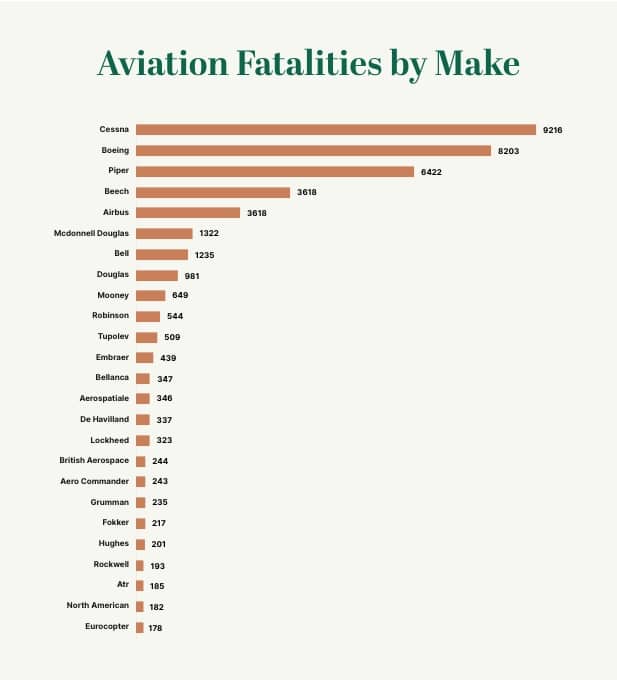
While it stands to reason that the manufacturers involved in the most crashes would also be involved in the most fatalities, this isn’t quite the case. Cessna crashes led to the more fatalities than any other make with 9,216 deaths), but Boeing leaps up to second with 8,203 deaths. Airbus – Boeing’s only real competitor – also jumped into the top five with 2,397 deaths. The two large jet manufacturers place in the top five should not be surprising, as they have essential had a duopoly over large jet market since the early 1990s, thanks to a series of mergers and acquisitions.
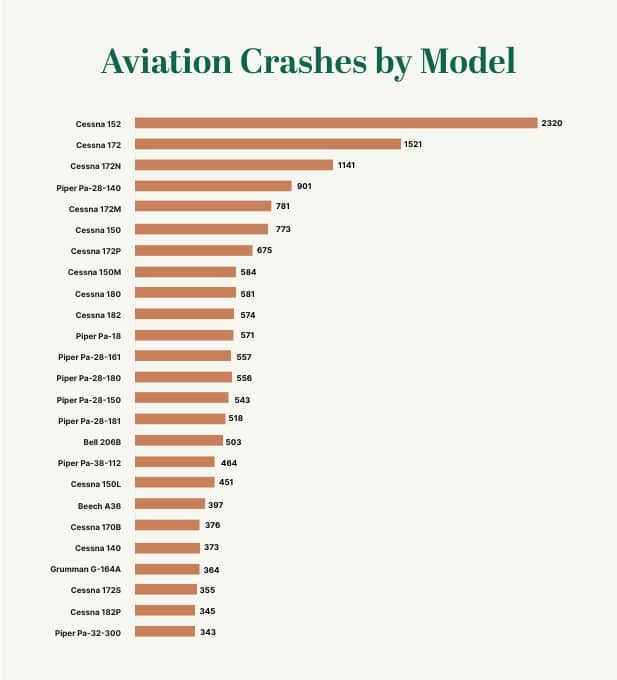
Which airplanes crash the most?
Cessnas and Pipers. In fact, the top 15 aircraft models in total crashes are all made by those two manufacturers – and nine of the top ten are Cessnas. The Cessna 152 was involved in nearly 800 more crashes than any other aircraft.
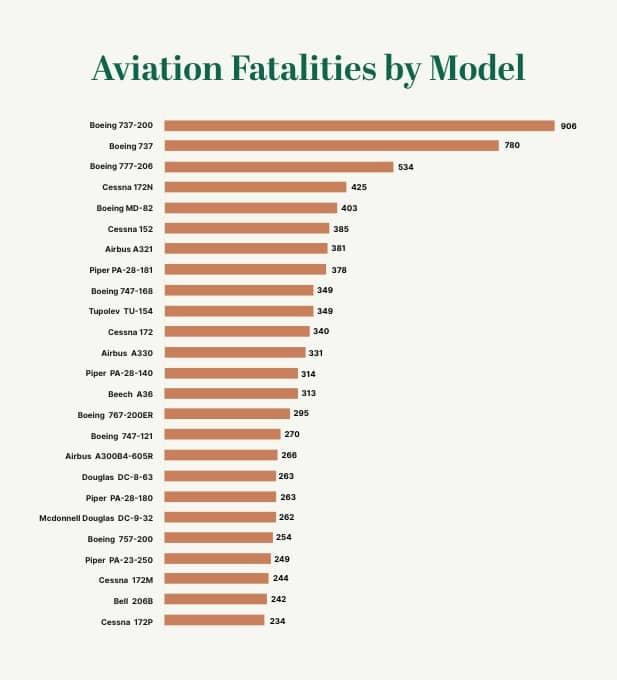
In terms of fatalities, Boeing aircraft occupy four of the top five – the Boeing 737-200 has killed the most people at 906 deaths, followed by the original Boeing 737, the Boeing 777-206 and the Boeing MD-82.
Here is a full list of the top 25 aircraft modes by crashes and fatalities:
Aircraft that
Crash the Most
| MAKE & MODEL | TOTAL CRASHES |
|---|---|
| Cessna 152 | 2320 |
| Cessna 172 | 1521 |
| Cessna 172N | 1141 |
| Piper PA-28-140 | 901 |
| Cessna 172M | 781 |
| Cessna 150 | 773 |
| Cessna 172P | 675 |
| Cessna 150M | 584 |
| Cessna 180 | 581 |
| Cessna 182 | 574 |
| Piper Pa-18 | 571 |
| Piper Pa-28-161 | 557 |
| Piper PA-28-180 | 556 |
| Piper Pa-18-150 | 543 |
| Piper PA-28-181 | 518 |
| Bell 206B | 503 |
| Piper Pa-38-112 | 464 |
| Cessna 150L | 451 |
| Beech A36 | 397 |
| Cessna 170B | 376 |
| Cessna 140 | 373 |
| Grumman G-164A | 364 |
| Cessna 172S | 355 |
| Cessna 182P | 345 |
Aircraft that
Killed the Most People
| MAKE & MODEL | TOTAL FATALITIES |
|---|---|
| Boeing 737-200 | 906 |
| Boeing 737 | 780 |
| Boeing 777 - 206 | 534 |
| Cessna 172N | 425 |
| Boeing MD-82 | 403 |
| Cessna 152 | 385 |
| Airbus A321 | 381 |
| Piper PA-28-181 | 378 |
| Boeing 747-168 | 349 |
| Tupolev TU-154 | 349 |
| Cessna 172 | 340 |
| Airbus A330 | 331 |
| Piper PA-28-140 | 314 |
| Beech A36 | 313 |
| Boeing 767-200ER | 295 |
| Boeing 747-121 | 270 |
| Airbus A300B4-605R | 266 |
| Piper PA-28-180 | 263 |
| Douglas DC-8-63 | 263 |
| Mcdonnell Douglas DC-9-32 | 262 |
| Boeing 757-200 | 254 |
| Piper PA-23-250 | 249 |
| Cessna 172M | 244 |
| Bell 206B | 242 |
The Most Deadly Aviation Disasters in History
When looking at the worst aviation disasters by total deaths, many were the result of terrorist attacks, bombings and military exercises. However, the 10 worst aircraft crashes in aviation history are:
-
The Tenerife Airport Disaster
Tenerife, Canary Island
March 27, 1977
Deaths: 583
Survivors: 61
Cause: Pilot Error
Aircraft Involved: KLM Royal Dutch Airlines Boeing 747-206B and Pan Am Boeing 747-121
-
Japan Airlines Flight 123
August 12, 1985
Mount Takamagahara, Japan
Deaths: 520
Survivors: Four
Cause: In-flight Structural Failure
Aircraft Involved: JAL Boeing 747-146SR
-
Charkhi Dadri Mid-Air Collision
November 12, 1996
Charkhi Dadri, Haryana, India
Deaths: 349
Survivors: None
Cause: Pilot Error Resulting in Mid-Air Collision
Aircraft Involved: Saudi Arabian Arilines Boeing 747-168B and Kazakhstan Airlines Illyushin II-76TD
-
Turkish Airlines Flight 981 Crash
March 3, 1974
Northeast of Paris, France
Deaths: 346
Survivors: None
Cause: Cargo Door Failure Due to Design Flaw
Aircraft Involved: Turkish Airlines McDonnell Douglas DC-10
-
Saudia Flight 163
August 19, 1980
Riyadh, Saudi Arabia
Deaths: 301
Survivors: None
Cause: In-flight Fire
Aircraft Involved: Saudia Lockheed L-1011-200
-
American Airlines Flight 191
May 25, 1979
Des Plaines, Illinois (A Suburb of Chicago)
Deaths: 273 (Two Ground Fatalities)
Survivors: None
Cause: Improper Maintenance (Engine Detachment)
Aircraft Involved: American Airlines McDonnell Douglas DC-10
-
American Airlines Flight 587
November 12, 2001
Queens, New York City, New York
Deaths: 265 (Five Ground Fatalities)
Survivors: None
Cause: Pilot Error (Excessive Ruder Use Leading to Separation of the Vertical Stabilizer)
Aircraft Involved: American Airlines Airbus A300B4-605R
-
China Airlines Flight 140
April 26, 1994
Nagoya, Japan
Deaths: 264
Survivors: Seven
Cause: Pilot Error and Poor Training
Aircraft Involved: China Airlines Airbus A300B4-622R
-
Nigeria Airways Flight 2120
July 11, 1991
Jeddah, Saudi Arabia
Deaths: 261
Survivors: None
Cause: Improper Maintenance (Under Inflated Tire That Lead to a Fire After Takeoff)
Aircraft Involved: Nationair Douglas DC-8-61 (Operated on Behalf of Nigeria Airways)
-
New Zealand Flight 901
November 28, 1979
Mount Erebus, Antarctica
Deaths: 257
Survivors: None
Cause: Computer Coordinates Where Changed to Steer Aircraft Directly into Mount Erebus
Aircraft Involved: Air New Zealand McDonnell Douglas DC-10-30
(Note: This list excludes planes that were shot down or destroyed in terrorist attacks – such as the attacks on the World Trade Center and the Pentagon on September 11, 2001 (2,996 total deaths), the Air India Flight 182 Bombing (329 deaths), Malysia Airlines Flight 17 (298 deaths) – or those involved in military exercises.)